
Written by
Pablo Pardo Garcia
Date added


An agent ran for three hours and produced the wrong answer. Nothing crashed. No alert fired. A customer noticed before you did.
Debugging that is different from debugging a web service, and most of the difficulty is structural: the thing that failed and the thing that caused the failure are often dozens of steps apart. This guide walks through a repeatable process for debugging an AI agent in production, including long-running agent runs that span restarts and sub-agents and how to make sure the same failure can't happen twice.
Why debugging agents is different
A traditional service fails where it breaks. You get a stack trace at the point of failure, and the point of failure is usually the point of cause.
Agents violate that assumption. An agent makes a sequence of decisions, each conditioned on the output of the last. A malformed tool argument at step 2 doesn't raise an error; rather it returns plausible-looking data that the agent happily builds on. Step 14 produces a confidently wrong result, and step 14 looks fine in isolation.
Three consequences follow, and they shape the whole process:
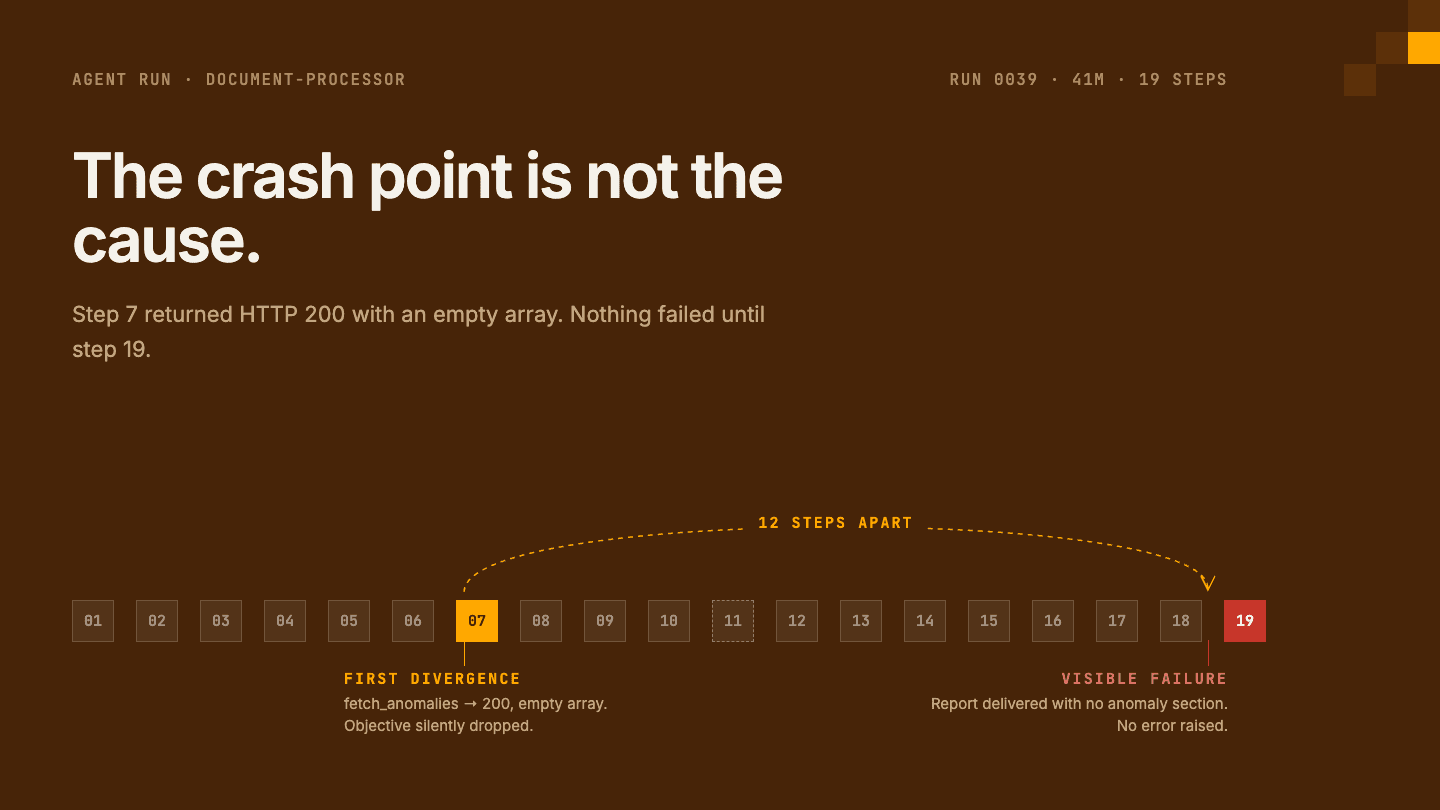
The crash point is not the cause. You need the first divergence not the last error.
Isolated steps look correct. Reviewing an individual LLM call rarely reveals the problem.
Silent failures are the norm. Many agent failures produce no error code at all.
This is why agent observability differs from LLM logging: you need the whole run as one connected object, not a pile of independent events.
Before you start: what you need in place
You can't debug what you didn't capture. Minimum viable instrumentation:
Every step as a span: LLM calls (model, prompt, response, tokens, latency) and tool calls (name, arguments, response or error, latency).
A session ID linking every span in one run, and surviving process restarts.
Sub-agent linkage: child runs attributed to their parent.
Trace-level querying, not just text search over logs. "Show me the run" has to be one query.
If you're missing the session ID or restart continuity, fix that first. Everything below depends on it.
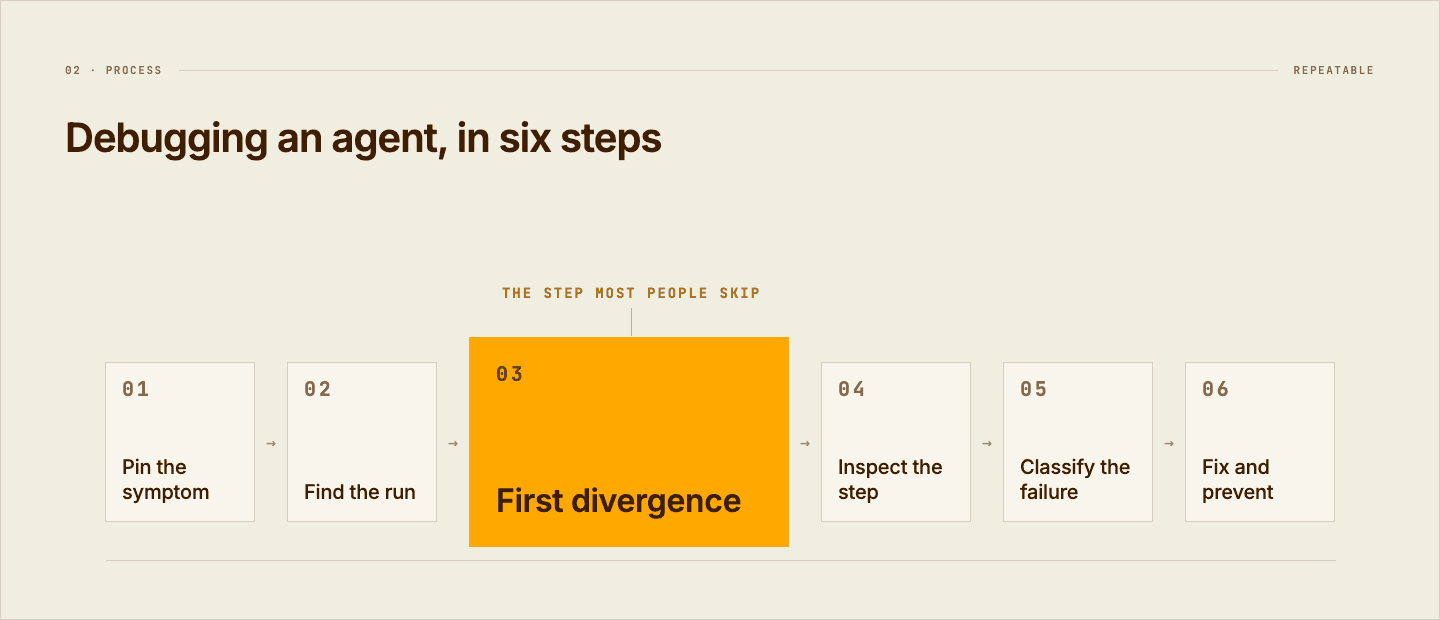
The six-step process
Step 1: Pin the symptom precisely
Before opening a trace, write down what "wrong" means in one sentence: wrong output, no output, took too long, cost too much, or did something it shouldn't have. Each points at a different part of the run. "The agent is broken" is not a debuggable statement; "the quarterly report omitted the security section" is.
Note the timestamp, the affected user or tenant, and the agent name. You'll need them to find the run.
Step 2: Find the run, not the log line
Retrieve the whole session, not the error that surfaced. You want one continuous timeline from first step to last, including retries and sub-agents. If your tooling returns forty separate log entries for one run, you're already fighting it.
With Rius you can do this from your dashboard or MCP: "show me the failed run for user X around 02:00" and get the session back without wasting time figuring out what went wrong.
Step 3: Walk forward to the first divergence
This is the step that matters most, and the one most people skip. Start at the beginning and move forward, asking at each step: is this what I expected? Stop at the first step where the answer is no, even if it produced no error and even if the visible failure came much later.
Practical signals of divergence:
A tool returned success with empty, truncated, or default data
A step's input doesn't match the previous step's output
The agent's stated plan changed without a triggering event
Latency or token count for a step is a clear outlier
The same step appears repeatedly with identical arguments
Resist the pull of the crash point. The error at the end is usually a symptom of a divergence much earlier.
Step 4: Inspect that step's inputs and outputs
At the divergence, read the full input and full output. Most root causes are visible here: a wrong argument type, a missing field, a truncated prompt, a tool response the agent misread as valid, or a constraint from step 1 that's no longer in context. Ask specifically: did the agent receive what it needed, and did it interpret what it received correctly? Those are two different failures with two different fixes.
Step 5: Classify the failure mode
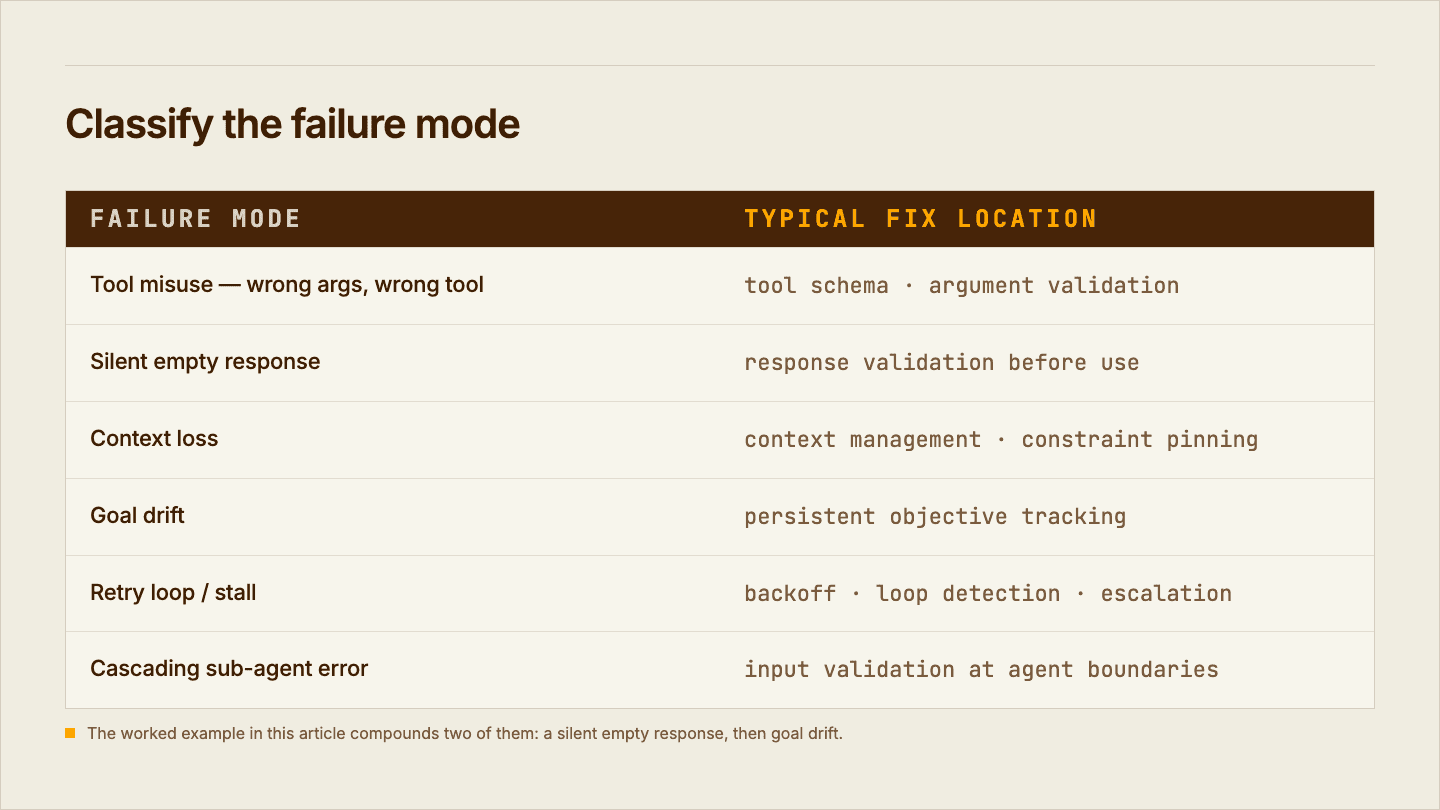
Naming the failure tells you where the fix belongs. The common agent failure modes:
Failure mode | Typical fix location |
Tool misuse (wrong args, wrong tool) | Tool schema, argument validation |
Silent empty response | Response validation before use |
Context loss | Prompt/context management, constraint pinning |
Goal drift | Persistent objective tracking |
Retry loop / stall | Backoff, loop detection, escalation path |
Cascading sub-agent error | Input validation at agent boundaries |
Check our full taxonomy of agent failure modes and how to detect each for more detailed read.
Step 6: Fix it, then make it unrepeatable
Ship the fix, then close the loop so the failure becomes a regression check: capture the triggering conditions from the real trace, define the expected behavior, and add it to your test set. Add an alert on the signal that would have caught it earlier: step-count outliers, empty tool responses, or quality scores rather than error rate alone.
A fix without a check means you'll debug this again in six weeks.
Example: the report that lost its second half
Symptom.
A reporting agent was asked to summarize quarterly metrics and flag anomalies. It returned a polished metrics summary with no anomaly section. No errors. 41 minutes, 19 steps.
Find the run.
Pull the full session for that user and timestamp, all 19 steps, including one restart at step 11.
Walk to the first divergence.
Steps 1–6 look right. At step 7, a `fetch_anomalies` tool call returns HTTP 200 with an empty array. The agent treats "no data returned" as "no anomalies exist" and drops the objective from its working plan. Steps 8–19 elaborate the metrics section, each individually coherent. The restart at step 11 reloads context that already excludes the anomaly objective, cementing the loss.
Inspect step 7.
The tool call was made with a date range that had been serialized incorrectly after an upstream formatting change, a valid request for a window containing no data. The tool behaved correctly. The agent's interpretation was the failure.
Classify.
Two compounding modes: a silent empty response (step 7) and goal drift (steps 8 onward), with the restart making it permanent.
Fix.
Validate the date range before the call; treat an empty result as unverified rather than negative; keep both objectives in a persistent checklist that survives restarts.
Prevent.
Add a regression case where `fetch_anomalies` returns empty and assert the agent still reports the anomaly objective as incomplete. Alert on runs that finish having addressed fewer objectives than requested. Note what this required: seeing step 7 and step 19 as parts of one run, across a restart. In tooling that treats each LLM call as an independent event, step 7 looks like a successful call and step 19 looks like a fine summary. The failure lives in the relationship between them.
Debugging long-running agents specifically
Long runs add three complications worth handling explicitly.
Restarts fragment the story.
If a restart starts a new trace, you lose the causal chain exactly where it matters. Your session ID must survive the restart; that's what one continuous session across restarts and sub-agents means in practice.
The evidence expires.
A failure reported Monday about a run from three weeks ago is undebuggable if the trace has been deleted. Retention that keeps older traces queryable is a debugging requirement, not a compliance nicety.
You should catch it live.
For runs measured in hours, post-hoc debugging is the expensive path. Real-time visibility plus alerts on the right signals turn a three-hour wrong answer into a five-minute intervention.
Common mistakes
Starting at the error instead of the beginning.
Reviewing one LLM call in isolation.
Trusting HTTP 200 as proof of a useful response.
Alerting only on error rate, which misses every silent failure.
Fixing the symptom step rather than the divergence step.
And debugging without the full session, which is less "debugging" than guessing.
FAQ
How do you debug an AI agent that fails silently?
Don't look for an error; look for the first divergence. Retrieve the full run and walk forward from the start until a step's output stops matching what you'd expect, paying attention to tool calls that returned success with empty or default data. Silent failures are found by comparing intent to behavior across the run, not by scanning for error codes.
What's the difference between debugging an LLM call and debugging an agent?
An LLM call is one input and one output, so you can evaluate it in isolation. An agent is a sequence of interdependent steps, so failures usually live in the relationship between steps: a bad output at step 3 corrupting step 12. Debugging agents means reading the whole run as one causal chain.
How do I find the root cause of an agent failure?
Walk the run forward from the first step and stop at the earliest point where behavior diverged from expectation, then inspect that step's full inputs and outputs. The root cause is almost always at the first divergence, not at the step where the visible error appeared.
What tools do I need to debug agents in production?
At minimum: span-level instrumentation of every LLM and tool call, a session ID that links all steps in a run and survives restarts, sub-agent linkage, and the ability to query at the trace level. Agent observability platforms provide this; log dashboards and chat-focused LLM tools generally don't preserve the causal chain.
How do I stop the same agent failure from recurring?
Convert each diagnosed failure into a regression test built from the real trace (the triggering inputs plus the expected behavior) and add an alert on the signal that would have caught it earlier, such as empty tool responses, step-count outliers, or objective-completion checks rather than error rate alone.
Debug agent runs where you already work
Debugging an AI agent comes down to one discipline: see the whole run, and find the first divergence rather than the last error. Everything else follows from that. GlassFlow keeps every step of every run as one continuous session, across restarts and sub-agents, queryable in milliseconds, and lets you ask your traces questions straight from your coding agent. If you need more information, get in touch.
Share the article
You might also like

Agent Infrastructure
AI agent failure modes: the seven ways agents fail in production
The seven ways AI agents fail in production: tool misuse, context loss, goal drift, retry loops, frozen agents, cascading errors & silent degradation.
Written by
Pablo Pardo Garcia
read article
read article

Data for Agents
Agents in production: what looks like a reasoning failure is usually a context failure
When an AI agent fails in production, it's usually reasoning correctly over stale, partial, or lossy inputs, not hallucinating. Why, and how context fixes it.
Written by
Ashish Bagri
read article
read article

Agent Observability
The real cost of self-hosting your agent observability stack
What it really costs to self-host Langfuse, Phoenix, or Laminar: ClickHouse and infra requirements, engineering hours, and real AWS pricing, single node vs. high availability
Written by
Armend Avdijaj
read article
read article


