
Written by
Ashish Bagri
Date added

Decision models answer typed questions with a probability per answer, at a fraction of an LLM's price and in milliseconds. The catch is the threshold that turns that probability into a decision: it depends on your data, not on a benchmark. We ran Cloudflare's Clef-flash next to Claude Haiku for six days on one task, on our own production logs, to find where that threshold sits and whether the decision model could take over. Short answer: not as a drop-in replacement, but as a filter in front of the LLM it would cut about 80% of the calls. You can run the same experiment on your own data with Tares.
Key Results
833 windows over 6 days, three watchers judging the same production logs
Clef-flash costs about $0.00025 per call vs about $0.006 for Haiku 4.5, roughly 25x cheaper
As a filter at threshold 0.4: about 80% fewer LLM calls, 12 of Haiku’s 18 escalations kept
As a drop-in replacement: no threshold worked
Why many LLM calls are classification in disguise
A lot of LLM calls in production are classification in disguise. Is this ticket urgent? Which team owns this alert? Does this pull request need a second reviewer? Does this window of logs need a closer look? A chat model answers these well, but it costs money on every call and returns a paragraph you then parse into a yes or no.
Since September 2026, a new kind of model appeared that does only this. Decision models, sometimes called System One models, take an input and a fixed set of questions and return a probability for every allowed answer, in one pass, for cents per thousand calls. If they hold up, a good share of LLM spend on routing and triage moves to them.
"If they hold up" is the part a benchmark cannot tell you. A probability of 0.6 means something different on your traffic than on a published dataset: your noise, your base rate of real problems and your cost of a false alarm decide where the line goes. The only way to know is to run the model next to what you use today, on your own data, and choose the threshold from the results. This post is one such experiment, with real production numbers, and the setup to run your own.
If you lead an engineering team, this section and the one at the end, "So, can it replace the LLM?", are the short version. The rest is for the engineers who would run the comparison.
What is a decision model? (System One models explained)
A decision model does not write text. You hand it a state (text or JSON) and a set of typed questions, and it returns a probability for every allowed answer, in one forward pass. Questions come in three types: noul (how likely a statement is true), choice (one of a set of options) and score (a place on a scale). TypeSafe's Jev started the category; Cloudflare followed with Clef and Clef-flash, open weights under Apache 2.0, and open copies like Kev and Laya run on your own GPU or even a CPU.
They fit any task that is a fixed decision over a structured input, made over and over: routing, triage, policy checks, flagging anomalies. You get a number to compare against a threshold instead of a paragraph to parse. Clef-flash, the 9B model we used, costs $0.09 per million input tokens on Workers AI and answers in tens of milliseconds.
A request is a state plus typed questions. These are the two our task used:
and gets back a probability per answer:
Wiring that into an application is the easy part: compare problem against a threshold, act on entity when it is above. Choosing the threshold is the hard part, and it is what the rest of this post is about. Each of these calls cost us about $0.00025, roughly 1/25 of the LLM call it would replace.
The task: does this window need a closer look?
We needed a real classification task with a real LLM doing it today. We took one from the AI SRE we run on Tares, our open-source platform for always-on agents, watching our own production: the Kubernetes cluster behind our agent tracing product. Into one Tares workspace go OTLP logs from every pod (about 5,000 lines every 10 minutes), Prometheus metrics from the same cluster, and GitHub.
Two agents share the work. Every 10 minutes a watcher looks at the last window and decides: nothing to report, or "investigate this service". On investigate, a root-cause agent (Claude Sonnet 5) takes over, reads that service's timeline and posts a note to Slack.
The watcher's call is the task we tested. It is made 144 times a day, it needs a yes or no plus which service, and today an LLM makes it: Claude Haiku 4.5, reading a generic summary that Tares builds for each window:
Haiku's prompt is a rule (a value that grew at least 3x and by at least 50 events, or is new with 50 or more) followed by judgment (ignore health checks, drops and routine noise). It can call a stats tool to drill down before it decides. Each call costs about $0.006. That is the baseline: could a decision model make the same call for 1/25 of the price?
The experiment: three watchers, one window
We ran three watchers side by side on the same watch trigger, so every 10 minutes all three judged exactly the same window:
Haiku on the summary. Today's watcher, live, handing off to the Sonnet root-cause agent.
Clef-flash on the summary. The same text Haiku reads, as the decision model's state.
Clef-flash on entity rows. The same window, reshaped for a model that cannot ask follow-up questions.
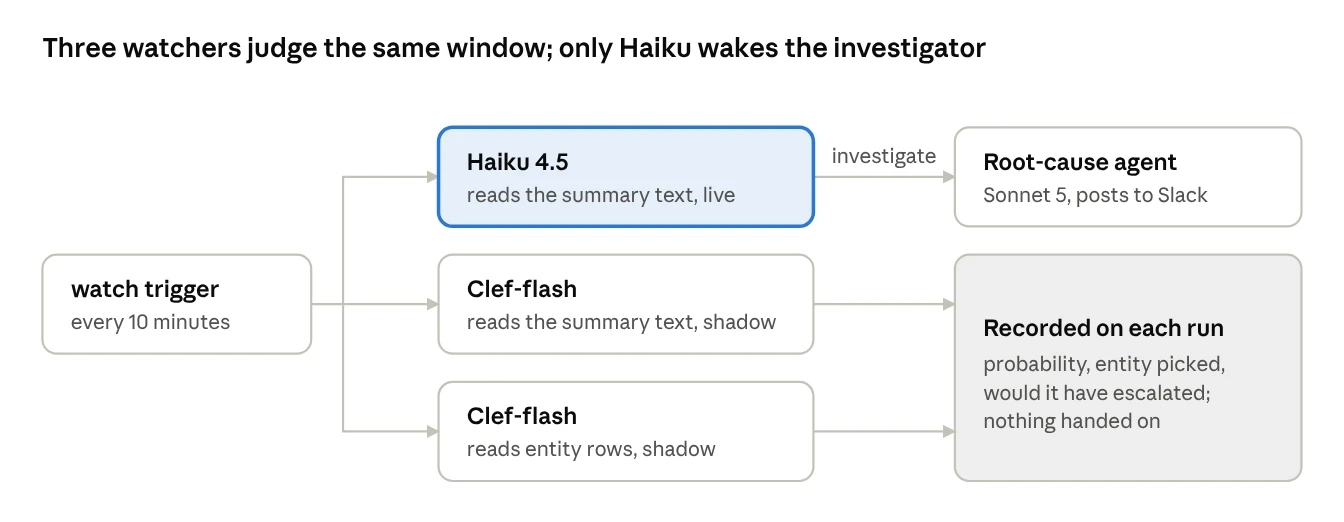
Diagram of three watchers (Claude Haiku on a summary, Clef-flash on a summary, Clef-flash on entity rows) judging the same 10-minute window in Tares
Why two Clef watchers? A decision model cannot call stats. When Haiku sees "401s up" in one table, it asks which service they come from. Clef-flash has to connect the status code table and the service table on its own. So for the third watcher, Tares builds the window as JSON instead: one row per service, each carrying its own signals, with the arithmetic already done (one row shown, the numbers illustrative):
Each count comes with its usual value and spread over the last six windows and a z score, so "126 401s" reads as ordinary when the usual is 90 plus or minus 40. Values under five events are dropped before the model sees them. The entity question's options are the row ids.
Both Clef watchers ran in shadow mode: each run records its probability, the entity it picked and whether it would have escalated, but concludes "nothing to report", so nothing reaches the root-cause agent or Slack. That let us choose the threshold afterwards instead of guessing it up front.
One thing to be clear about. Haiku's decisions are the reference here, not the truth. The ground truth would be the root-cause agent's verdict on each escalation, and as you will see, we got fewer of those than we wanted.
Clef-flash vs Claude Haiku: results after six days
The test ran from 6 October 12:54 to 12 October 07:55 UTC: 833 windows, every one judged by all three watchers, every run finished. (We dropped one window from the summary watcher, where an upgrade briefly switched its input.)
Haiku escalated 18 times, about 2% of windows. Most were repeats of a few patterns: 404 and 307 bursts on ingress-nginx, 428 and 404 bursts on argus, churn on cilium-agent, a scanner probing a UI.
The root-cause agent judged only 3 of them, and called all 3 harmless. Four more ended without a conclusion, two of them by running out of rounds before we raised its cap from 6 to 12. The other 11 never ran: on 9 October the agent hit the $10 lifetime budget we had set on it, and every escalation after that was stopped before it called the model. So we have no confirmed real incident in this period, and every comparison below is agreement with Haiku, not correctness.
Both decision watchers carry real signal. On the windows Haiku escalated, Clef-flash's average probability was about 0.5; on the rest, about 0.2. Ranked against Haiku's calls, the area under the ROC curve was 0.86 for the summary text and 0.82 for entity rows, where 1.0 is perfect and 0.5 is a coin flip.
No single threshold makes either one a replacement. At 0.5 each fires on about 117 windows, six times as often as Haiku, and still misses a third of Haiku's calls. Raise the threshold and the false alarms drop, but the misses climb faster:
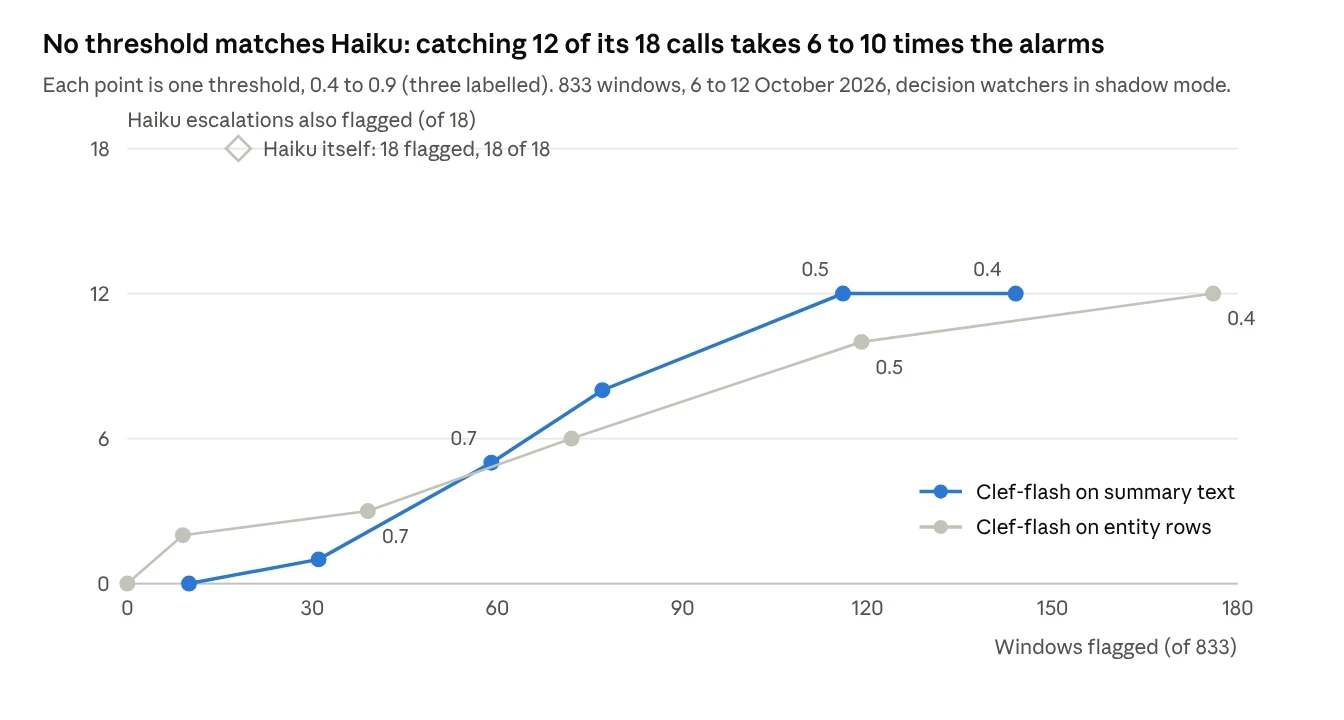
Chart of Clef-flash threshold vs windows flagged and share of Haiku's 18 escalations caught
Threshold | Summary text: windows flagged | Summary text: Haiku's 18 also flagged | Entity rows: windows flagged | Entity rows: Haiku's 18 also flagged |
|---|---|---|---|---|
0.4 | 144 | 12 | 176 | 12 |
0.5 | 116 | 12 | 119 | 10 |
0.6 | 77 | 8 | 72 | 6 |
0.7 | 59 | 5 | 39 | 3 |
0.8 | 31 | 1 | 9 | 2 |
0.9 | 10 | 0 | 0 | 0 |
The same numbers as the chart above.
The summary-text watcher sits above the entity-rows one at most thresholds: for the same number of alarms, it agrees with Haiku slightly more often.
Entity rows name the right service more often. On Haiku's 18 escalations, entity rows picked the same service about 10 times, the summary text about 6. Both have a habit, though. Entity rows chose ingress-nginx in 336 of 833 windows, the biggest service by volume, which happened to help because most escalations were ingress. The summary text chose cilium-agent 238 times, a small service whose counts swing all day. The extra "kind of problem" question added little: it answered "none" 760 times out of 833.
Cost: Haiku spent $4.92 over the six days, plus $2.51 for the root-cause runs it started. Each Clef-flash watcher spent about $0.20, roughly 25 times less, at about 2,500 input tokens per window.
Latency was 16 to 22 seconds per run for all three. That is not the models: Clef-flash answers in tens of milliseconds. All three watchers wake at the same second and count the same large window in the database, and the queries queue behind each other.
How to choose a decision model threshold
The default line is not a setting to trust. At 0.5, the obvious place to start, Clef-flash flagged six times as many windows as the LLM. Where the line belongs depends on what you use the model for, and both answers came from our data, not from the model card:
As a replacement, no threshold works here. Any line that keeps the false alarms near Haiku's level misses most of what Haiku catches.
As a filter, 0.4 does. The summary-text watcher would have passed 17% of windows on to Haiku and kept 12 of its 18 escalations, cutting the LLM calls by about 80%. The open question is the 6 it filtered out.
The input moves the result as much as the threshold. The same model, fed entity rows instead of the text an LLM reads, ranked windows slightly worse but named the right service far more often. Which input you pick depends on whether you need "is something wrong" or "where".
Plan your labels before you start. You tune against something. Ours were the LLM's own decisions, with the root-cause agent's verdict as ground truth, and a $10 budget on that agent stopped all but 3 verdicts. An LLM's decisions, an on-call engineer's tags or a list of past incidents all work, as long as you have them.
Can a decision model replace an LLM? Not yet, but it works as a filter
For this task, not yet. But its probability carries real signal for 1/25 of the cost, so the pattern that works today is a cascade: the decision model scores every input cheaply, and the LLM only sees what crosses a threshold you tuned on your own data. We expect the same for other classification-shaped LLM calls, and it is cheap to check: run a decision model in shadow next to the LLM for a few days and read the curve.
Next, we are raising the root-cause agent's budget so every escalation gets a verdict again, running a few more days to label the windows where the watchers disagree, and then trying the filter for real: Clef-flash first, Haiku only above the line.
Run this experiment on your own data with Tares
Benchmarks tell you how a model does on someone else's dataset. What you need to know is how it does on your services, your noise and your incidents. This comparison takes an afternoon to set up in Tares 1.43 (a release candidate as we write this):
Connect a source: OTLP logs, Prometheus, a webhook, GitHub. Tares labels the events by entity.
Create a schedule trigger with
every: 10mand the labels to count insummary_by.Under Settings, Decision models, add Cloudflare Workers AI (an Account ID and a Workers AI token), TypeSafe Jev, or the URL of a model you host yourself.
In one project, add the LLM agent that does the job today, plus one agent per decision model with the preset "Triage with a decision model", each in shadow mode and wired to the same trigger.
Let it run for a few days. Each run keeps its probability, the entity it picked and whether it would have escalated; Export CSV on the agent's runs tab gives you the lot.
Pair the runs by firing time, sweep the threshold, and compare against the windows your current watcher, or your on-call, flagged.
When one wins, untick Shadow and hand its
investigateto your root-cause agent.
Some edges are still rough: the export is per agent, so you pair rows by time yourself, and a chat-model watcher has no shadow mode, so keep a second one out of the handoff. A full tutorial with the comparison script follows this post.
FAQ:
What is a decision model?
A decision model, also called a System One model, takes an input and typed questions and returns a probability for each allowed answer in one pass, instead of generating text.
Can a decision model replace an LLM?
Not as a drop-in in our test. As a filter at threshold 0.4, it would have cut LLM calls about 80% and kept 12 of Haiku’s 18 escalations.
How do you choose a decision model threshold?
Run the model in shadow mode next to your current LLM for a few days, pair runs by time, sweep the threshold and compare against your LLM’s or on-call’s decisions.
How much cheaper is a decision model vs an LLM?
About $0.00025 per Clef-flash call vs about $0.006 for Claude Haiku 4.5, roughly 25x.
Share the article
You might also like

Data for Agents
The lakehouse organized data for analysts. Nobody has organized it for agents.
The modern data stack was built for human analysts. AI agents read, push, and shape the model themselves. Here's why they need a new kind of data layer.
Written by
Ashish Bagri
read article
read article

Data for Agents
Agents in production: what looks like a reasoning failure is usually a context failure
When an AI agent fails in production, it's usually reasoning correctly over stale, partial, or lossy inputs, not hallucinating. Why, and how context fixes it.
Written by
Ashish Bagri
read article
read article

Agent Observability
The real cost of self-hosting your agent observability stack
What it really costs to self-host Langfuse, Phoenix, or Laminar: ClickHouse and infra requirements, engineering hours, and real AWS pricing, single node vs. high availability
Written by
Armend Avdijaj
read article
read article

Agent Infrastructure
Can a decision model replace an LLM? Tune it on your own data first
We ran Cloudflare's Clef-flash next to Claude Haiku for 6 days on production logs. As a filter, it cut LLM calls ~80%. Test it on your own data with Tares.
Written by
Ashish Bagri
read article
read article


