
Written by
Armend Avdijaj
Date added


Most agent failures don't announce themselves. No exception, no 500, no alert. The agent finishes, returns something plausible, and the problem surfaces hours later from a customer, not a dashboard. In MAST, a UC Berkeley study of 1,642 multi-agent system traces, the open-source systems tested failed on 41% to 87% of tasks. The two most common failure modes were agents repeating steps and reasoning that didn't match the action taken. Verifiers often only checked whether code compiled: one generated chess program passed review and still broke at runtime.
The standard advice is to collect traces, cluster the failures, and turn them into regression tests. Sound advice, and you should do it. But it answers a different question: how do I stop this recurring?
This guide answers the other one: how do I catch it now?
What failure detection means for agents
AI agent failure detection is the practice of identifying when an agent has diverged from correct behavior, ideally while it's still running. It differs from traditional error monitoring because most agent failures produce no error: the agent completes successfully and is confidently wrong. Detection, therefore, depends on comparing behavior against expectations across the entire run, not on catching exceptions.
This guide covers how to build that detection. For what each failure actually is and why it happens, start with the taxonomy: the seven agent failure modes.
A five-stage detection framework
Capture → Baseline → Detect → Intervene → Prevent
Stages 1 and 2 are set up. Stages 3 and 4 are what most detection advice skips. Stage 5 is where you converge with eval-based practices.
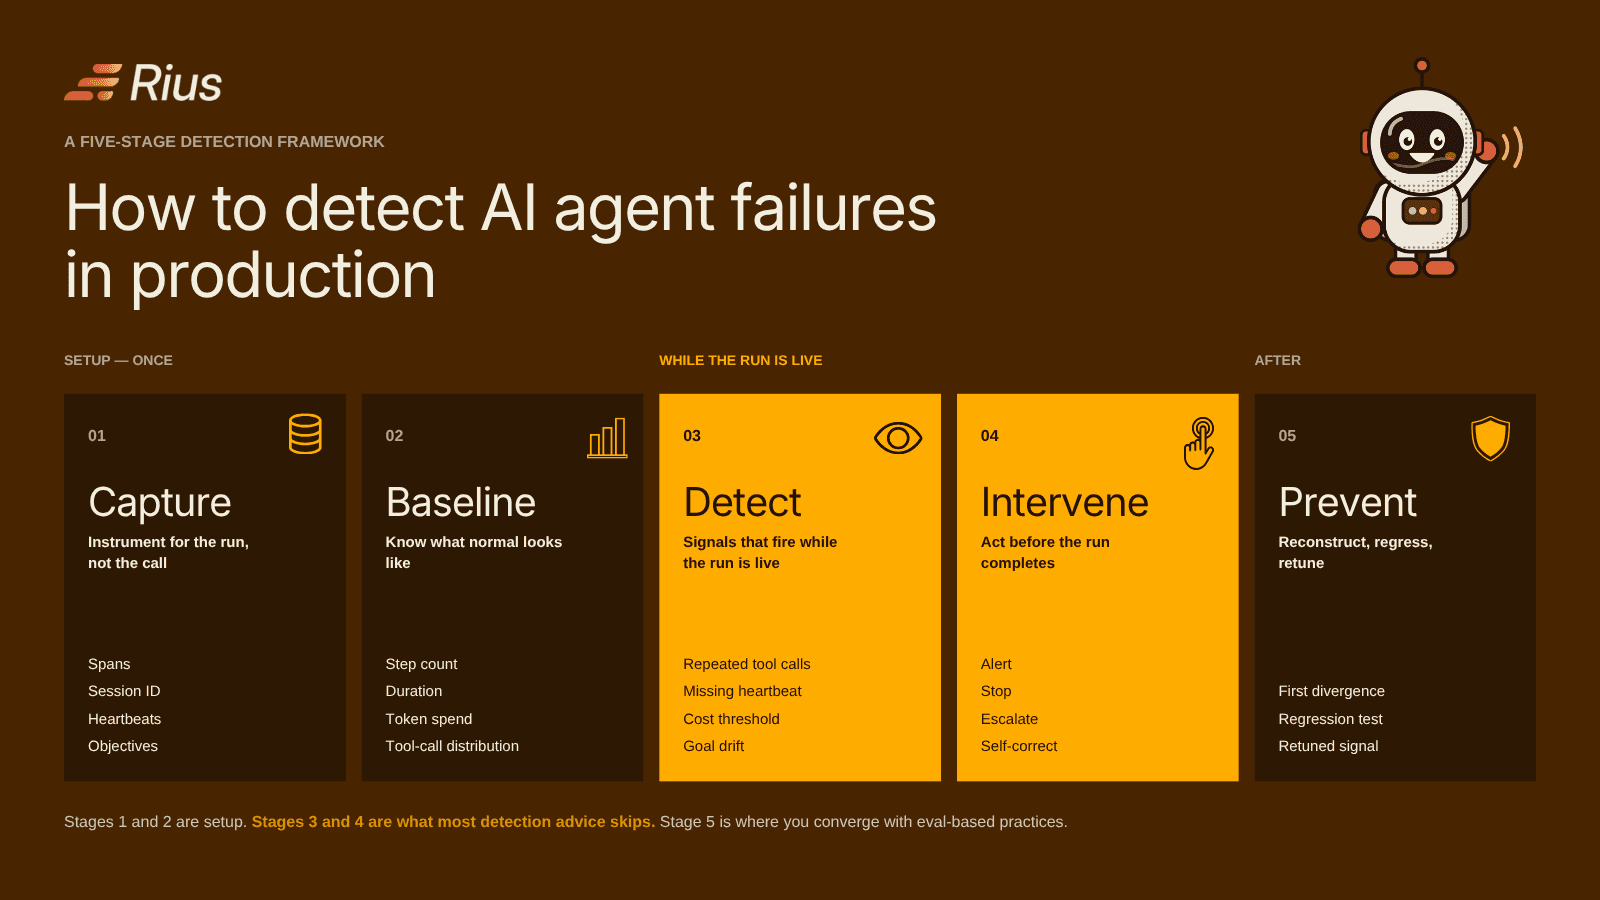
Stage 1 | Capture: instrument for the run, not the call
You cannot detect what you didn't record, and recording individual LLM calls isn't enough. Minimum viable capture:
Every step as a span: LLM calls (model, prompt, response, tokens, latency) and tool calls (name, arguments, response or error, latency)
Session ID: linking every span in one run and surviving process restarts
Sub-agent linkage: child runs attributed to their parent
Progress heartbeats: a periodic signal that the agent is still advancing, not merely alive
Declared objectives: what the run was asked to accomplish, stored so it can be checked against what it did
That last one is the most commonly missing and the most valuable. Goal drift is structurally undetectable if nothing ever recorded the original goal.
Session continuity across restarts matters more than it sounds: if a restart begins a new trace, the causal chain breaks exactly where you need it.
Stage 2 | Baseline: know what normal looks like
Not every signal needs a baseline, and building one from raw production history can hide the failures you're looking for. If 40% of past runs already contained a silent empty response, a threshold built on that history treats 40% as normal.
Start with invariants: conditions that should never occur in a healthy run, however often they've happened before. A tool returning success with an empty payload. The same call repeated with identical arguments. A missing heartbeat. A declared objective dropping out of the plan. Alert on the first occurrence.
Use baselines only for signals that legitimately vary from run to run:
Step count per run
Duration
Token spend
Tool-call distribution (i.e., which tools, how often)
Build these from runs you've verified as correct, such as spot-checked outputs, user-confirmed results, or runs that passed evals, not from all production traffic.
Every silent failure you find manually becomes a new invariant. Search historical traces for its signature, tag the affected runs, remove them from the baseline, and alert on that signature from then on. The baseline gets cleaner and the invariant list grows with every incident.
Stage 3 | Detect: signals that fire while the run is live
Each failure mode leaves a signature, and most are visible before the run ends. Silent failures arrive in three types, and the distinction matters because each needs a different response:
Cognitive failures happen in the content of the agent's reasoning or context. From stale data, knowledge gaps or wrong semantics.
Infrastructure failures are runtime hazards you can't design away. This is any tool unavailability, message loss, rate limits.
Recovery failures are when the self-correction layer fails to absorb a fault it should have caught. These include retry budget exhausted, escalation never fired, or fallback quit.
None of them raise an error in standard agent observability.
Failure mode | Failure type | Detection signal |
Tool misuse | Cognitive | Argument schema violation; tool called outside expected distribution |
Silent empty response | Cognitive | Tool returns success with empty, default, or truncated payload |
Retry loop | Recovery | Same tool + same arguments repeated above threshold |
Reasoning stall/freeze | Cognitive or Infrastructure | No progress heartbeat within expected interval |
Cost runaway | Cross-cutting signal | Token spend crossing a per-run budget |
Step-count outlier | Cross-cutting signal | Steps exceeding the agent's p95 |
Context loss | Cognitive | Declared constraint absent from recent context window |
Goal drift | Cognitive | Current plan no longer references a declared objective |
Cascading sub-agent error | Cognitive | Child run failed or returned invalid output; parent proceeded |
Two stages, not one. Running an LLM judge over every production run is too expensive to be real. The workable design is two-stage: stage one runs on everything and is cheap. Structural rules over the shape of the run, plus a small model scoring "does this need a second look." Stage two is an LLM judge which runs only on the small share stage one flags, returning a named failure, the evidence, a confidence score and a one-line reason.
Stage one catches the structural signals in the table above. Stage two is what turns "something looks odd" into "here is what went wrong and why."
Stage 4 | Intervene: act before the run completes
Detection with no response path is just faster forensics. Define what happens when a signal fires:
Alert: page on-call for SLA-bound agents; quieter channels for the rest
Stop: kill the run on a cost runaway or confirmed retry loop rather than let it drain
Escalate: hand to a human after N failed attempts instead of retrying indefinitely
Steer: tell the agent what went wrong and how to fix it, mid-run. The detector names the symptom, identifies the stale or wrong input, and hands back a correction the agent can act on, before the run completes. This is the step that turns detection into recovery. Rather than stopping a run and handing it to a human, the agent receives the diagnosis and redoes the failed step with the right input. For more information on how to do this with Rius check the Pre-defined alerts or see more on how to query traces from your coding agent with MCP.
Stage 5 | Prevent: reconstruct, regress, retune
Once the incident is handled:
Reconstruct the run and find the first divergence, not the step that visibly failed. In the example below, those are twelve steps apart. For the step-by-step method, see how to debug an AI agent run. The guide covers fixing one broken run; this one covers building the system that catches the next one earlier.
Convert it to a regression test built from the real trace: triggering inputs plus expected behavior.
Retune the signal. Ask what would have caught this sooner, and add it. This is the compounding step where every incident tightens the net.
A practical example of how to detect AI agent failures in production
Symptom: A reporting agent asked to summarize quarterly metrics and flag anomalies returned a polished metrics summary with no anomaly section. No errors. 41 minutes, 19 steps, one restart.
What the signals showed. At step 7, fetch_anomalies returned HTTP 200 with an empty array, a silent empty response. The agent read "no data" as "no anomalies exist" and dropped the objective. An objective-completion check would have fired at step 8: one of two declared objectives no longer appeared in the active plan. Instead, steps 8–19 elaborated the metrics section, each step individually coherent. The restart at step 11 reloaded context that already excluded the anomaly objective, making the loss permanent.
Root cause: A date range serialized incorrectly after an upstream change, requesting a window that contained no data. The tool worked correctly. The agent's interpretation was the failure.
Detection latency: Reported by a user the next day. Detectable at step 7, roughly 12 minutes in.
What was added: Empty-response validation before use; treat empty results as unverified rather than negative; a persistent objective checklist that survives restarts; an alert on runs completing with fewer objectives addressed than requested.
What to measure
Reframe the scorecard around detection, not just resolution:
MTTD (mean time to detect): the headline number. Track silent and loud failures separately; the gap between them is your blind spot.
Detected-before-completion rate: the share of failures caught while the run was still live. This is the number that tells you whether detection is actually proactive.
Detected-before-user-report rate: the credibility metric.
Failure rate by mode: tells you where to invest next.
Cost of failed runs: makes the case in terms leadership acts on.
MTTR matters, but it's downstream. You can't resolve what you haven't detected.
Common mistakes
Alerting only on error rate, which misses every silent failure. Instrumenting LLM calls but not tool calls. Losing the session on restart, so the causal chain breaks where it matters most. Never recording declared objectives, making goal drift undetectable by construction. Waiting for traces to close before computing metrics, so dashboards reflect only the runs that finished, a minority if your agents run long. And treating the visibly failing step as the root cause.
Start smaller than the framework suggests
You don't need all of this on day one. A minimal version that converts most silent failures into loud ones:
Capture every step with a session ID that survives restarts.
Add a progress heartbeat.
Alert on three things: repeated identical tool calls, missing heartbeat, per-run cost threshold.
Record declared objectives and check them at completion.
After each incident, add the signal that would have caught it sooner.
That's roughly a week of work.
Detect failures while there's still a run to save
GlassFlow Rius watches the agent's loop, spots what goes wrong, and tells it how to fix it. Every step is captured as it happens, one session across restarts and sub-agents, metrics on open traces, heartbeats on agents that stop making progress, and silent failure detectors that surface what no error code ever will. Start your 30-day free trial today or open the Rius quickstart.
FAQ
How do you detect AI agent failures that produce no error?
By comparing behaviour to expectation rather than watching for exceptions. Check whether tool responses are usable, whether declared objectives still appear in the agent's plan, whether step counts and costs sit within normal range, and whether the agent is still making progress. Silent failures are found by monitoring signals, not error codes.
What is MTTD for AI agents?
Mean time to detect: the elapsed time between an agent diverging and something noticing. For long-running agents, it's the metric that matters most, because a low MTTD is what makes intervention possible before the run completes.
Can you detect agent failures while the run is still going?
Most of them. Retry loops, frozen agents, cost runaways, tool misuse, silent empty responses, context loss, and goal drift all leave signals mid-run. It requires progress heartbeats and metrics computed on open traces rather than closed ones. Gradual quality degradation is the main exception, since it only appears across many runs.
How is failure detection different from evaluation?
Evaluation scores behaviour against criteria, usually before shipping or on sampled runs. Detection identifies divergence in live production traffic, ideally in time to act. They're complementary: detection tells you something is wrong now; evaluation stops it recurring.
What's the most common agent failure mode?
Tool-related failures: wrong arguments, wrong tool, or a response that returns successfully with no usable data. They're also the most damaging, because a bad value early silently corrupts every step built on it. See the full taxonomy of agent failure modes for more information.
Share the article
You might also like

Agent Infrastructure
AI agent failure modes: the seven ways agents fail in production
The seven ways AI agents fail in production: tool misuse, context loss, goal drift, retry loops, frozen agents, cascading errors & silent degradation.
Written by
Pablo Pardo Garcia
read article
read article

Agent Observability
The real cost of self-hosting your agent observability stack
What it really costs to self-host Langfuse, Phoenix, or Laminar: ClickHouse and infra requirements, engineering hours, and real AWS pricing, single node vs. high availability
Written by
Armend Avdijaj
read article
read article

Agent Observability
How to Debug an AI Agent: A Step-by-Step Guide
How to debug an AI agent in production: find the run, trace it to the first divergence, classify the failure mode, and ship a fix. A step-by-step guide." slug: "blog/what-is-agent-observability
Written by
Pablo Pardo Garcia
read article
read article


